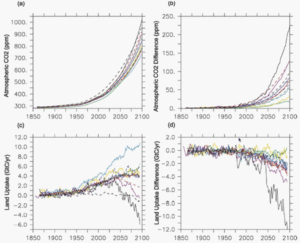
Figure: (a) Atmospheric CO2 for the coupled simulations (ppm) as simulated by the HadCM3LC (solid black), IPSL-CM2C (solid red – including ORCHIDEE), IPSL-CM4-LOOP (solid yellow – including ORCHIDEE), CSM-1 (solid green), MPI (solid dark blue), LLNL (solid light blue), FRCGC (solid purple), UMD (dash black), UVic-2.7 (dash red), CLIMBER (dash green), and BERN-CC (dash blue). (b) Atmospheric CO2 difference between the coupled and uncoupled simulations (ppm). (c) Land carbon fluxes for the coupled runs (GtC/yr). (d) Differences between coupled and uncoupled land carbon fluxes (GtC/yr).
Reference: P. Friedlingstein, P. Cox, R. Betts, L. Bopp W. von Bloh, V. Brovkin, P. Cadule, S. Doney, M. Eby, I. Fung, G. Bala, J. John, C. Jones, F. Joos, T. Kato, M. Kawamiya, W. Knorr, K. Lindsay, H.D. Matthews, T. Raddatz, P. Rayner, C. Reick, E. Roeckner, K.-G. Schnitzler, R. Schnur, K. Strassmann, A.J. Weaver, C. Yoshikawa and N. Zeng, 2006. Climate–Carbon Cycle Feedback Analysis: Results from the C4MIPModel Intercomparison. Journal of Climate, 19: 3337-3353


